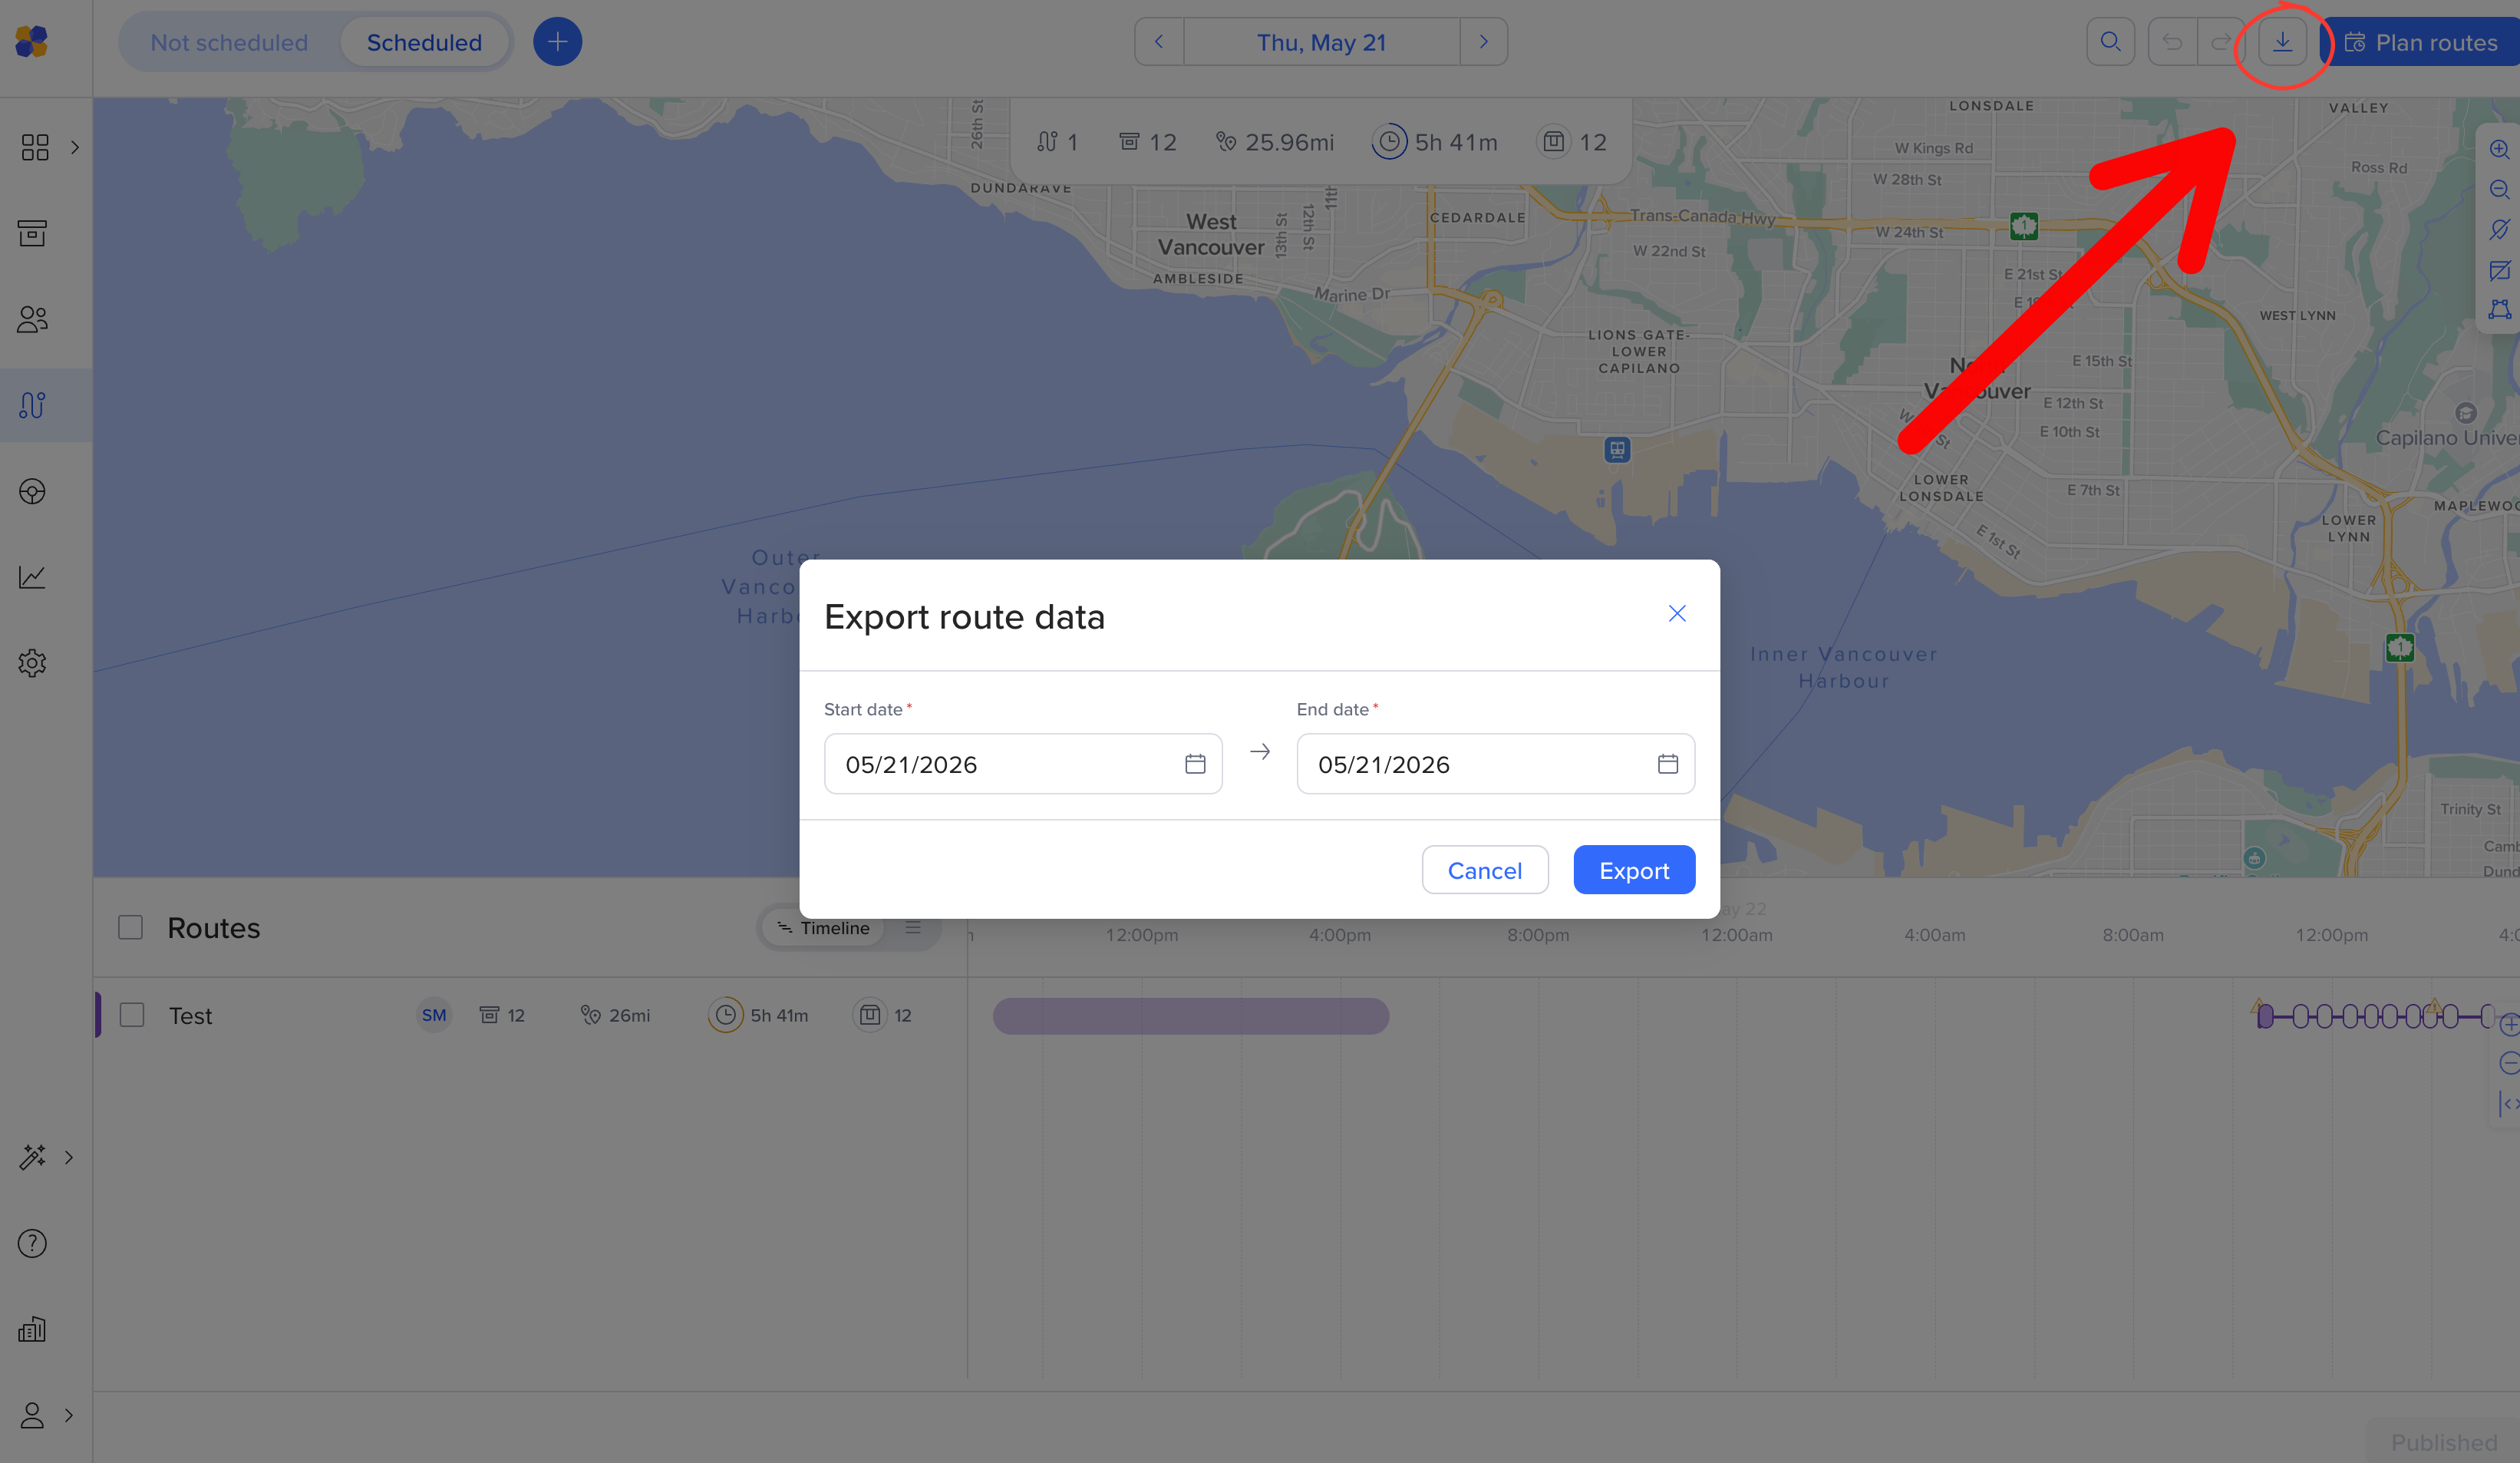
Do you need to download your data? Click on the Download icon on the top-right of your screen and choose what date range you need. Your route data will download in CSV format onto your computer. See more details about this here:
Download or export route data
Print a hard copy of your route manifests
Looking for reports on your drivers and routes? Click on the graph icon on the left navigation bar.
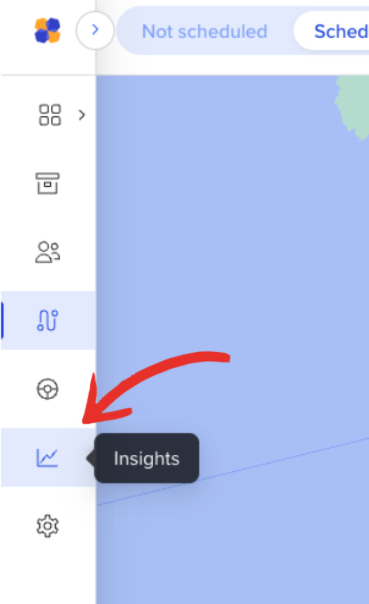
Here, you can track completed routes over time and uncover trends that reveal how your business is evolving.
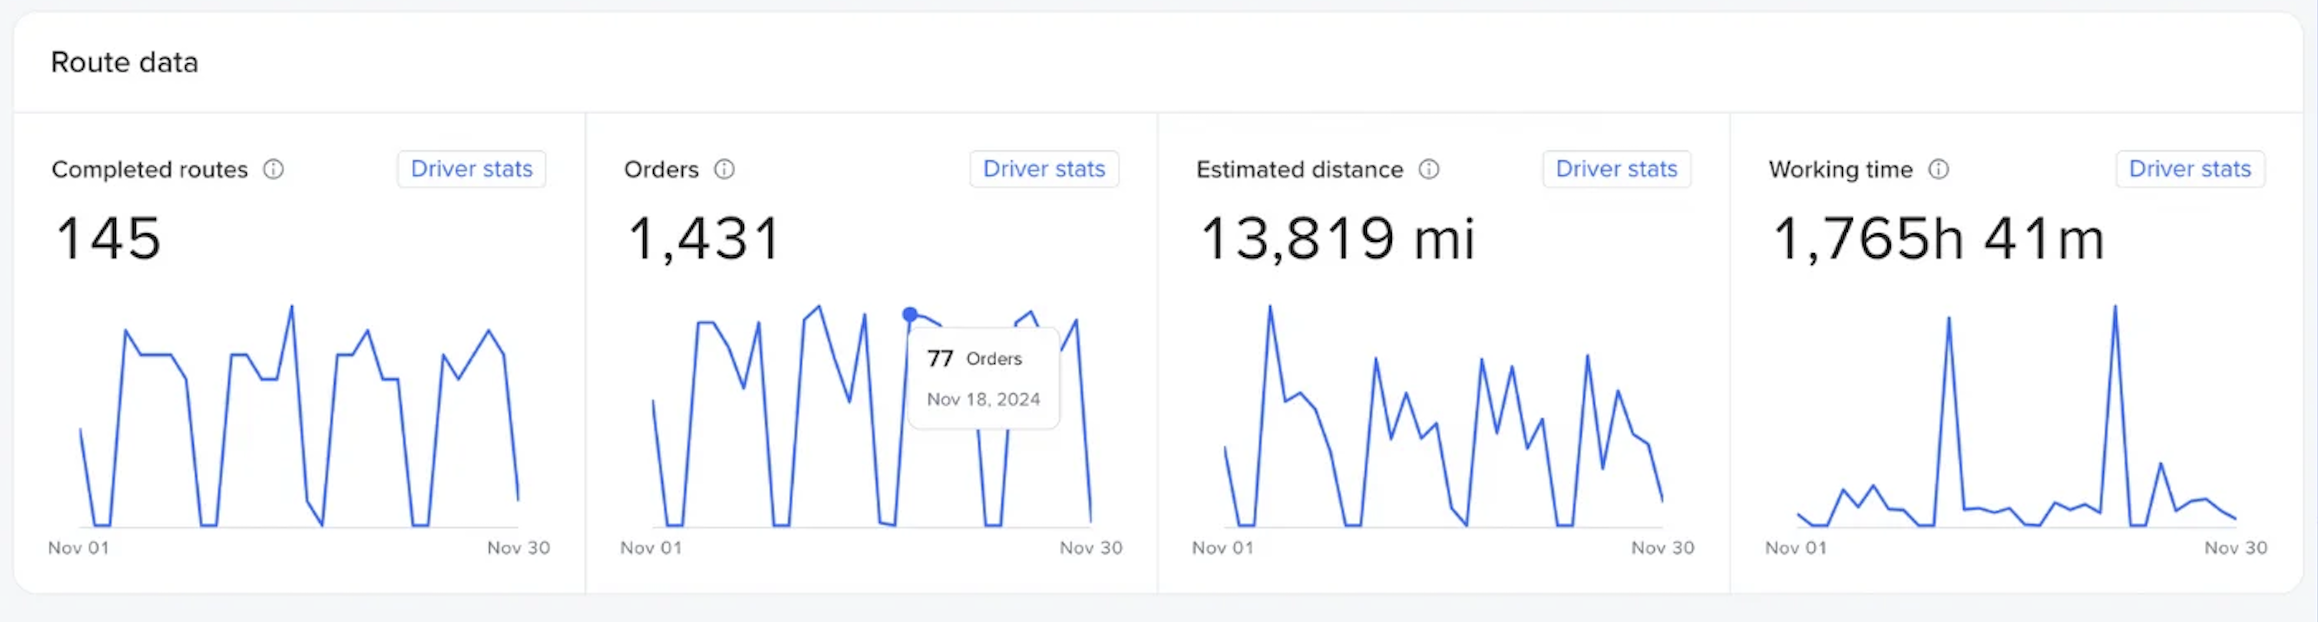
The Insights page currently shows the following metrics:
number of completed routes
number of orders
estimated total distance
total actual working time
Click on Driver stats to see a breakdown of each stat by driver.
Hover over the graph to inspect the trend lines, or look at the chart below to see the numbers across your drivers.
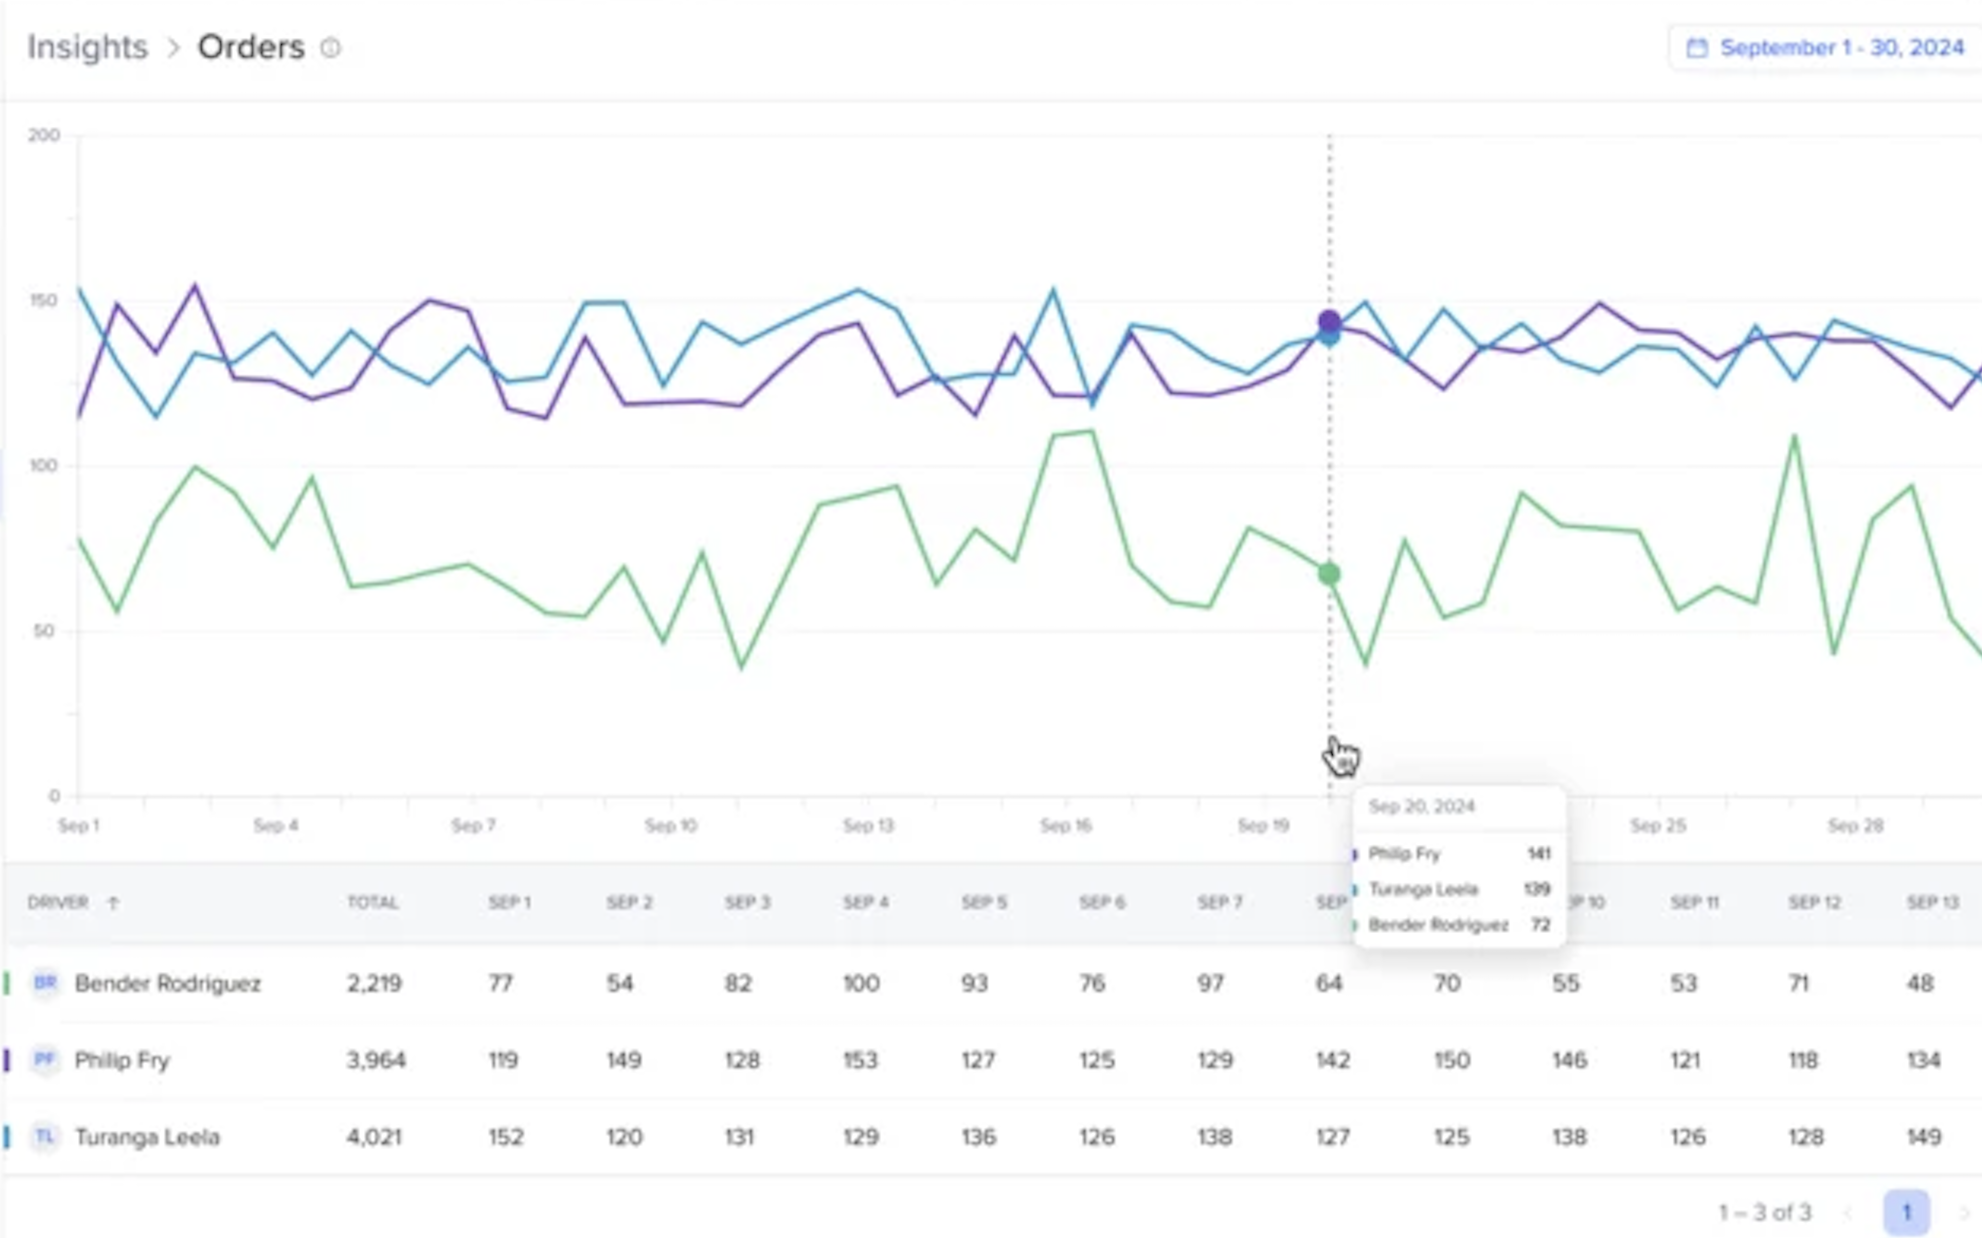
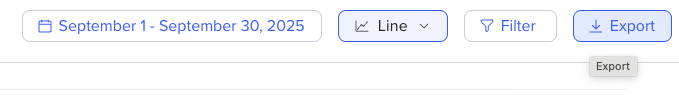
You can view these stats by date range in the upper-right corner.
Click the Export button in the top right-hand corner of the insights page
You can download up to 1 month of data (or 2500 orders, whichever is less).
* Please keep in mind that your Insights page crosses over all of your workspaces, and is not individual to the workspace you are working in.